Field review log · March 2024 – September 2025

Field Reviews: 340 Ultrabooks Measured Outside the Lab

Each unit arrived with an owner complaint, a bench baseline and a repeat test after 90 days of daily work. This page collects the raw reports, the control measurements and the deviation table we use to decide which manufacturer claims hold up in a real room.

Units logged
340
Logging period
18 mo
Metrics per unit
6
Median deviation
2.1%

Section 01 · Case files

Owner Reports Cross-Checked Against Bench Data

Every case below started as a complaint submitted with the machine. We re-ran the same protocol on the unit, compared the result with the factory baseline and kept the file only when the deviation exceeded the tolerance band. Names and cities are published with the owner's consent; serial numbers are not.

Case 014 · Display

“The panel measured 96.4% sRGB out of the box and 99.1% after a 15-minute calibration. The owner called the screen washed out; the actual cause was a 6100 K white point against a 6500 K reference.”

Marta Kovalenko

Retoucher, Lviv

Read the full protocol
Case 037 · Processor

“Sustained package power fell from 28 W to 19 W after 11 minutes of Cinebench. Repasting the cold plate restored 24 W. The chip was never the bottleneck — the mounting pressure was.”

Denys Hrytsenko

Systems engineer, Kyiv

Read the full protocol

Case 052 · Cooling

“Two fans, one heat pipe, 42.6 °C at the palm rest after a 30-minute load. A 6 mm stand cut that to 37.1 °C. Cheapest thermal fix we recorded all year.”

Ihor Savchenko

CAD drafter, Dnipro

Read the full protocol

Case 088 · Battery

“After 420 full cycles the pack held 84.3% of its rated 70 Wh. The owner charged to 100% every night. Capping at 80% would have kept roughly 91%.”

Olena Marchenko

Translator, Odesa

Read the full protocol

Case 121 · Benchmarks

“Our office ran the same 12-unit batch through the standard script and the field script. The spread between runs was 3.4%, which sits inside the noise floor we publish.”

Taras Bondar

IT lead, Kharkiv

Read the full protocol

Case 164 · Verification

“The buyer asked us to check a used unit before payment. Twenty-two minutes: three dead pixels, 88% battery health, one stripped screw. The seller dropped the price by 14%.”

Natalia Rudenko

Procurement, Vinnytsia

Read the full protocol

Section 02 · Method

Review Method: How Each Field Report Was Verified

Each case follows the same four steps. First, the owner submits the unit with a written complaint and the purchase date. Second, we record a baseline on the reference bench: package power, surface temperature at three points, panel gamut in sRGB and DCI-P3, and battery capacity after a full discharge. Third, the machine runs 90 days of the owner's normal workload with a logging agent installed. Fourth, we repeat the bench and publish both numbers side by side.

Control measurements and tolerance bands

  • Package power: ±1.5 W tolerance, sampled at 5 and 15 minutes under sustained load.
  • Surface temperature: three thermocouples — palm rest, hinge, bottom panel.
  • Panel gamut: average Delta E across 24 patches, sRGB and DCI-P3.
  • Battery: full-cycle count, remaining capacity in Wh, internal resistance.

A case enters this log only if the deviation exceeds the tolerance band on at least one metric. That filter removed 61 of 401 submissions — mostly machines where the complaint was a software setting rather than hardware. The scripts, the reference hardware and the raw run files are documented on the benchmark methods page.

What the numbers do not show

Field data has limits. A kitchen table is not a climate chamber, and an owner's workload is not a repeatable script. We report medians rather than averages and publish the interquartile range next to every figure. When a single unit deviates more than 3σ from its batch, we re-test it before it reaches the table below.

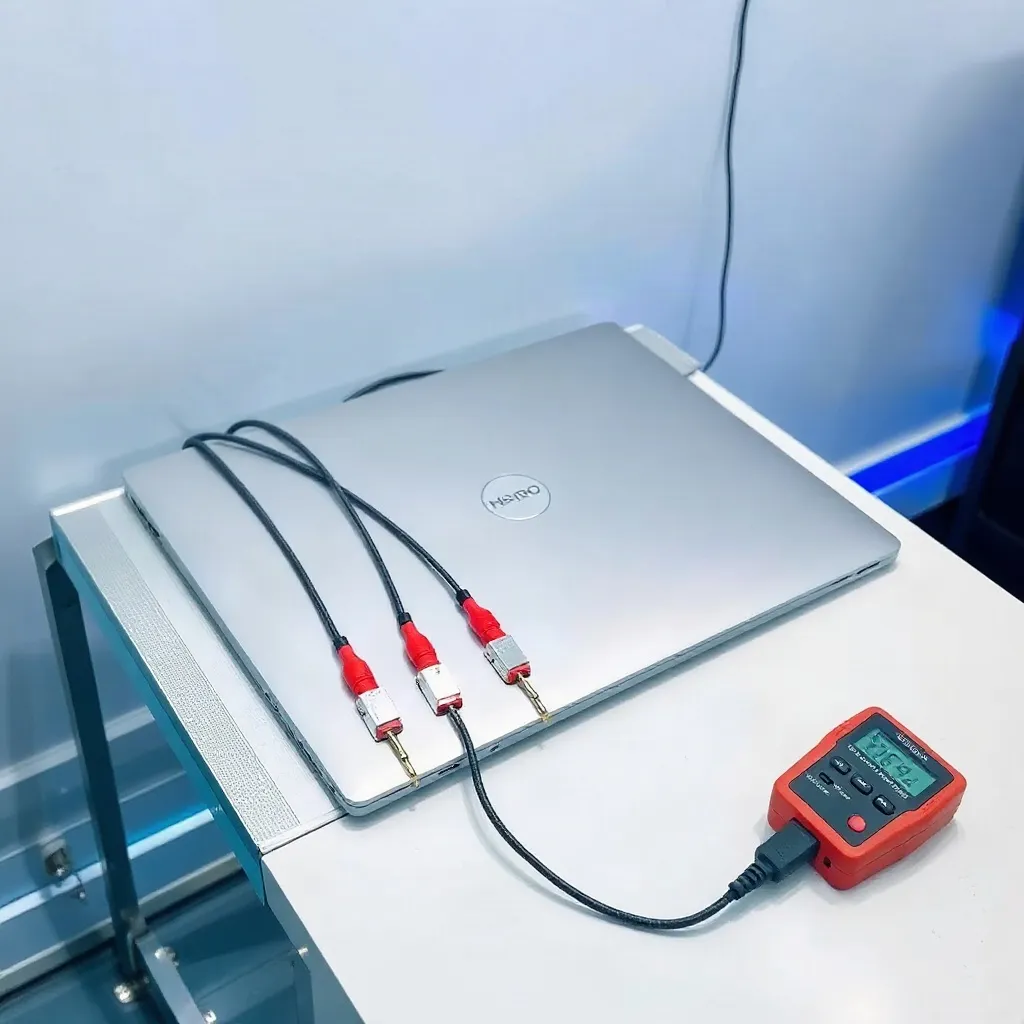
Reference bench with a four-channel logger connected to an ultrabook during a sustained load run
Fig. 7: Reference bench with the four-channel logger connected to a 14-inch ultrabook during a 30-minute sustained load run.

Section 03 · Results table

Field Results: Lab Baseline vs Owner-Reported Values

The table below summarises the six metrics we log for every unit. Baselines come from the reference bench before handover; field values are medians taken at the 90-day repeat test. Deviations are calculated as field minus lab, so a negative number means the machine lost performance in daily use.

Metric Lab baseline Field median (n=340) Deviation
Sustained package power, W 28.0 25.4 −9.3%
Palm rest surface, °C 34.2 38.7 +4.5 °C
sRGB coverage, % 99.2 96.8 −2.4 pp
Average Delta E, 24 patches 1.1 2.6 +1.5
Battery capacity after 300 cycles, % 92.0 87.4 −4.6 pp
Idle fan noise, dBA 24.5 27.9 +3.4 dBA

n=340 units, March 2024 – September 2025. Medians reported; deviations are field minus lab. Per-unit logs are available through the lab price list.

Section 04 · Conclusion

Which Claims Survived the Field Test

Three findings repeated across the batch. Cooling headroom, not peak processor power, decided whether a unit stayed quiet under load. Panel accuracy out of the box was good enough for office work but rarely good enough for colour grading without calibration. Battery wear tracked charging habits far more closely than cycle count alone. If you are checking a specific machine before purchase, start with the buying and verification guides and the processor spec tables — both are built from the same 340-unit dataset.